
Finnvera's year 2024
Welcome to Finnvera Group’s Annual Report 2024. On this page you will find a summary of the year’s highlights, key figures and our PDF reports.
PDF publications
Key figures
Domestic financing
LOANS AND GUARANTEES GRANTED
EUR 0.9 bn
(1.8)
NUMBER OF CLIENTS AT YEAR END
21,100
(23,100)
Export financing
EXPORT CREDIT GUARANTEES AND SPECIAL GUARANTEES GRANTED
EUR 2.9 bn
(5.5)
EXPORT CREDITS GRANTED
EUR 0.6 bn
(0.5)
Finnvera Group
RESULT
EUR 228 bn
(433)
BALANCE SHEET TOTAL
EUR 14.8 bn
(14.3)
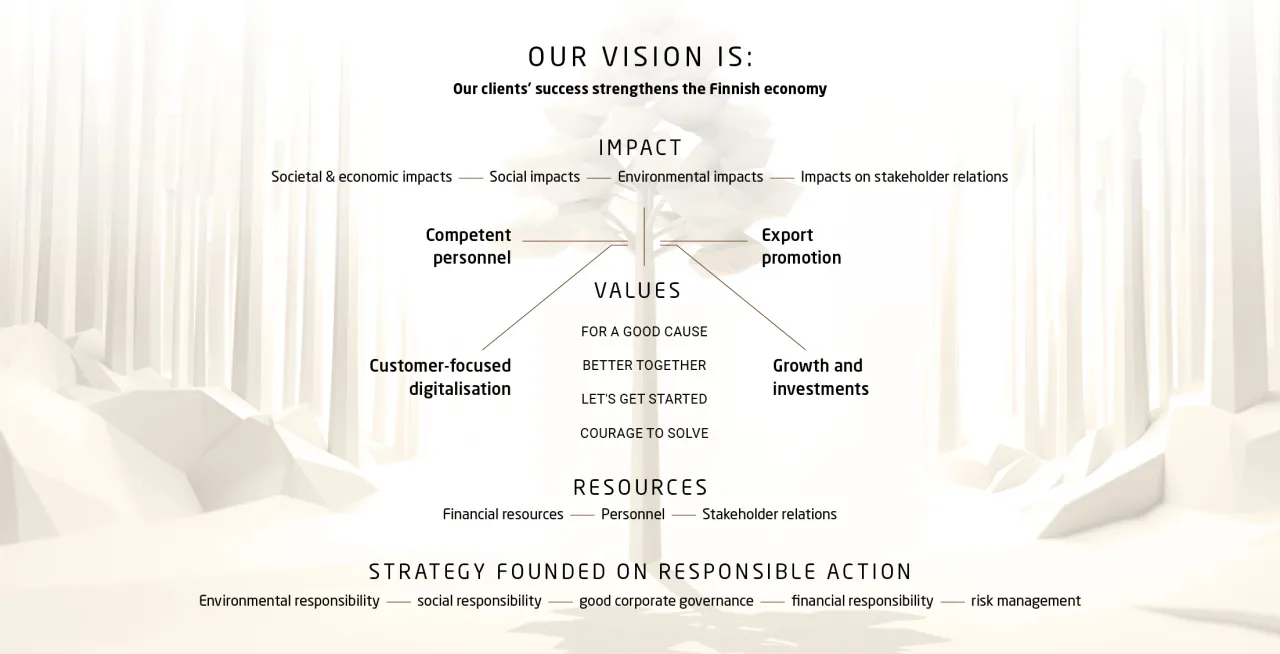
This is how Finnvera creates value
Share page: